Plotting Data
Obselete
The newest version of this interface parses data directly, producing a nicely formatted CSV.
Check out the example
The data from the pressure control system is saved in a nonstandard format and needs to be parsed before you can use it. As part of the python interface, there are some utillities designed for parsing data and saving the parsed data.
Take a look at the “plot_data.py” example in the Python Interface for more details (copied here for ease).
import os
from utils.parse_data import DataParser
from utils.get_files import get_files_recursively
from utils.get_files import get_save_path


# Get the desired save path from save_paths.yaml
base_path = get_save_path(which='default')

# Set the folder to use within the base data folder
folder = 'example'

# Parse and graph the data, then save it
data_path=os.path.join(base_path, folder)
filenames = get_files_recursively(data_path, filter_extension='.txt')

parser = DataParser(data_path = data_path)
for _, filename_rel, full_filename in filenames:
    print(filename_rel)
    parser.parse_data(filename_rel)
    parser.plot(filename = filename_rel.replace('.txt','.png'),
                ylabel="Pressure (psi)",
                time_from_zero = True)
    parser.save_data(filename_rel.replace('.txt','.pkl'))
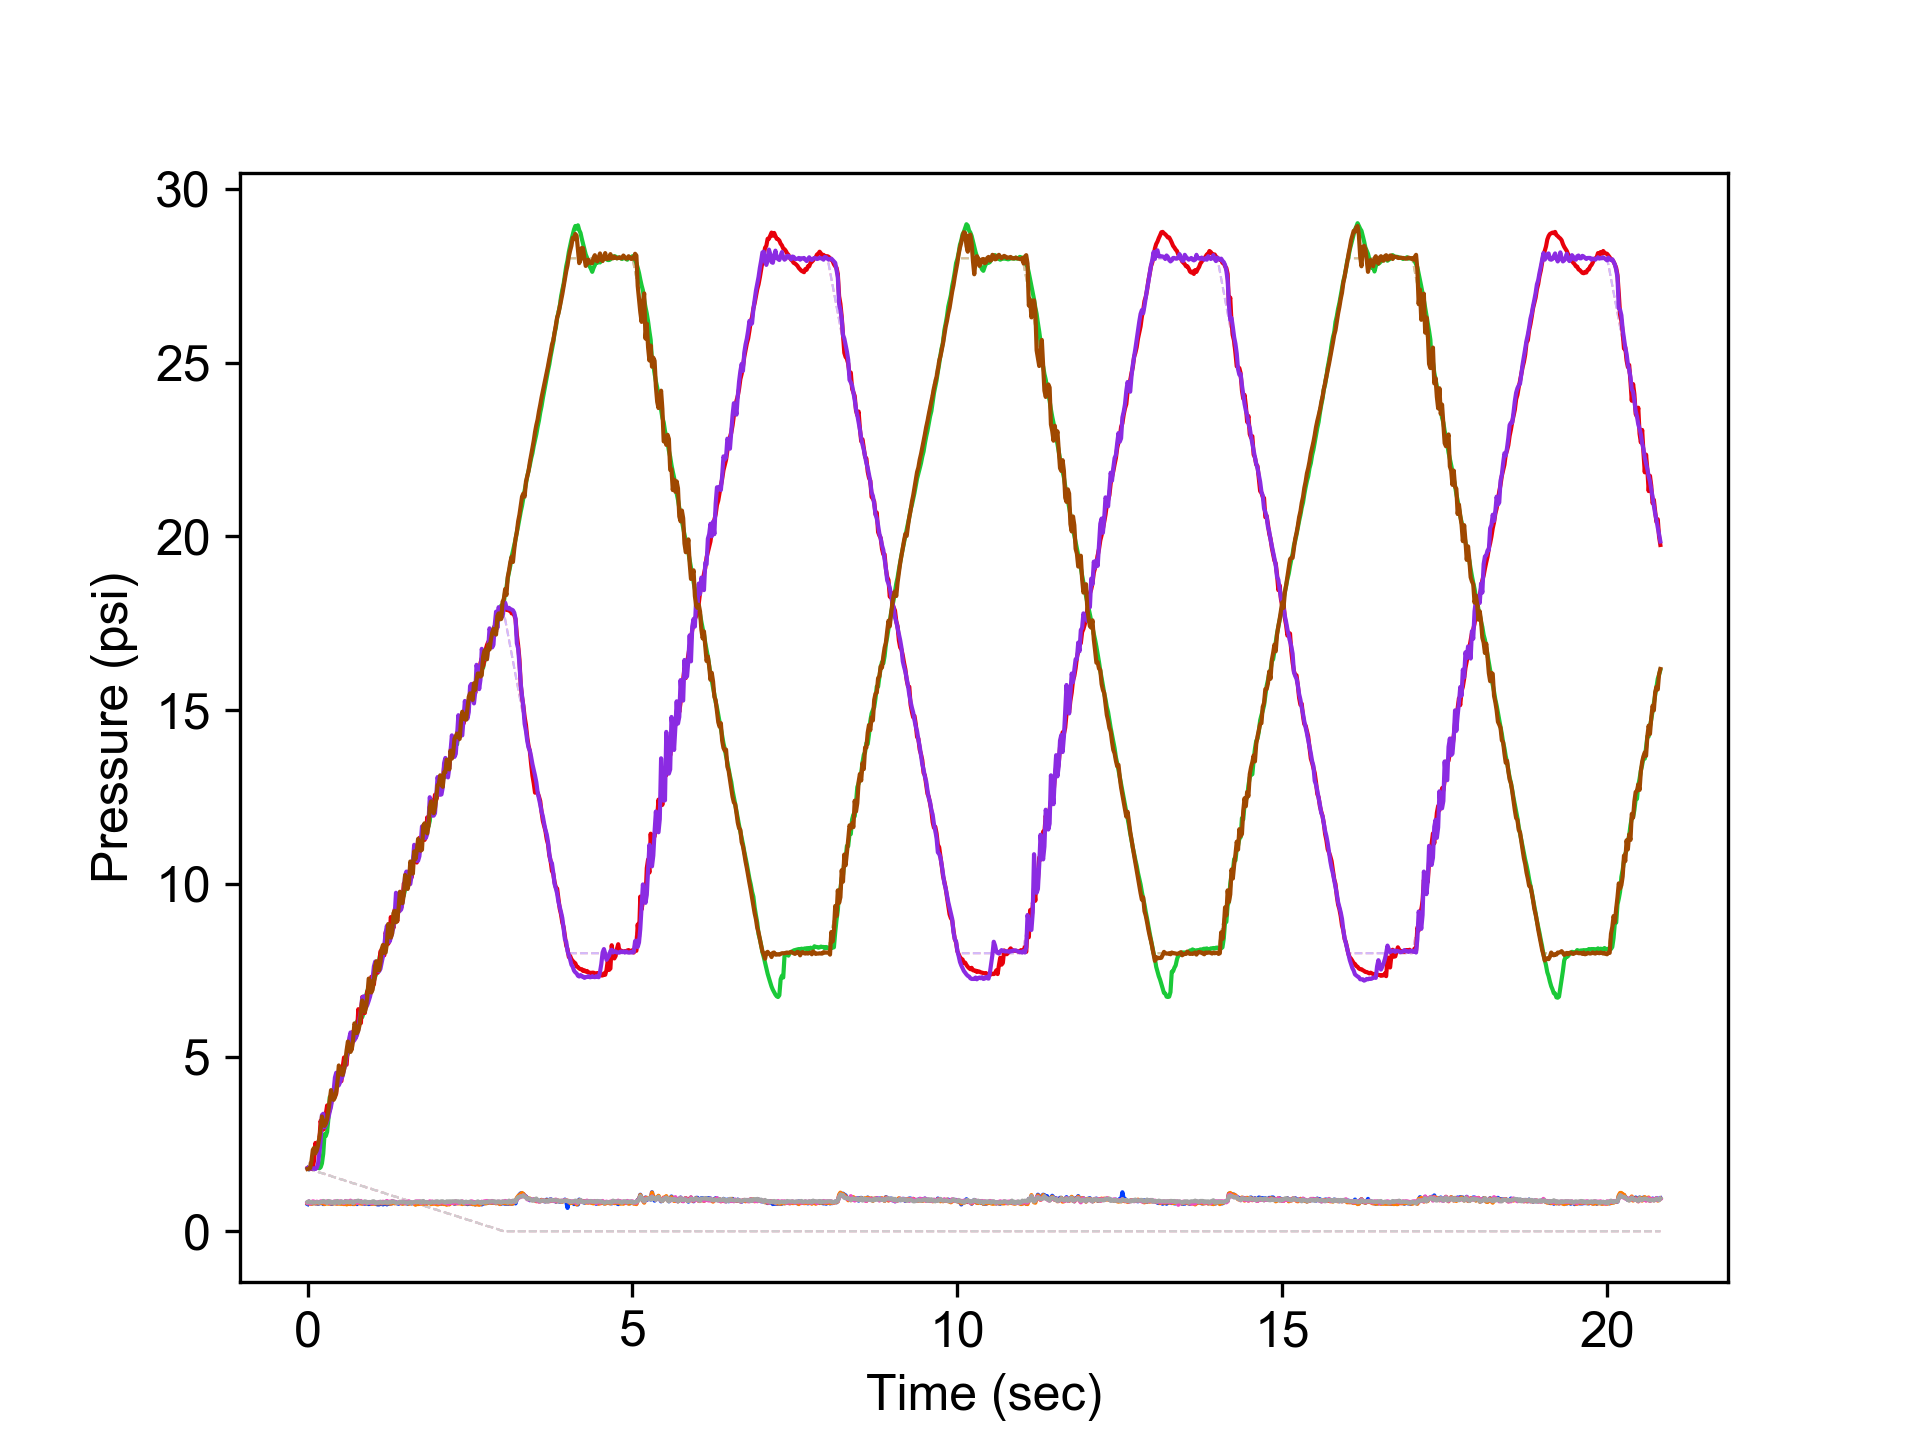
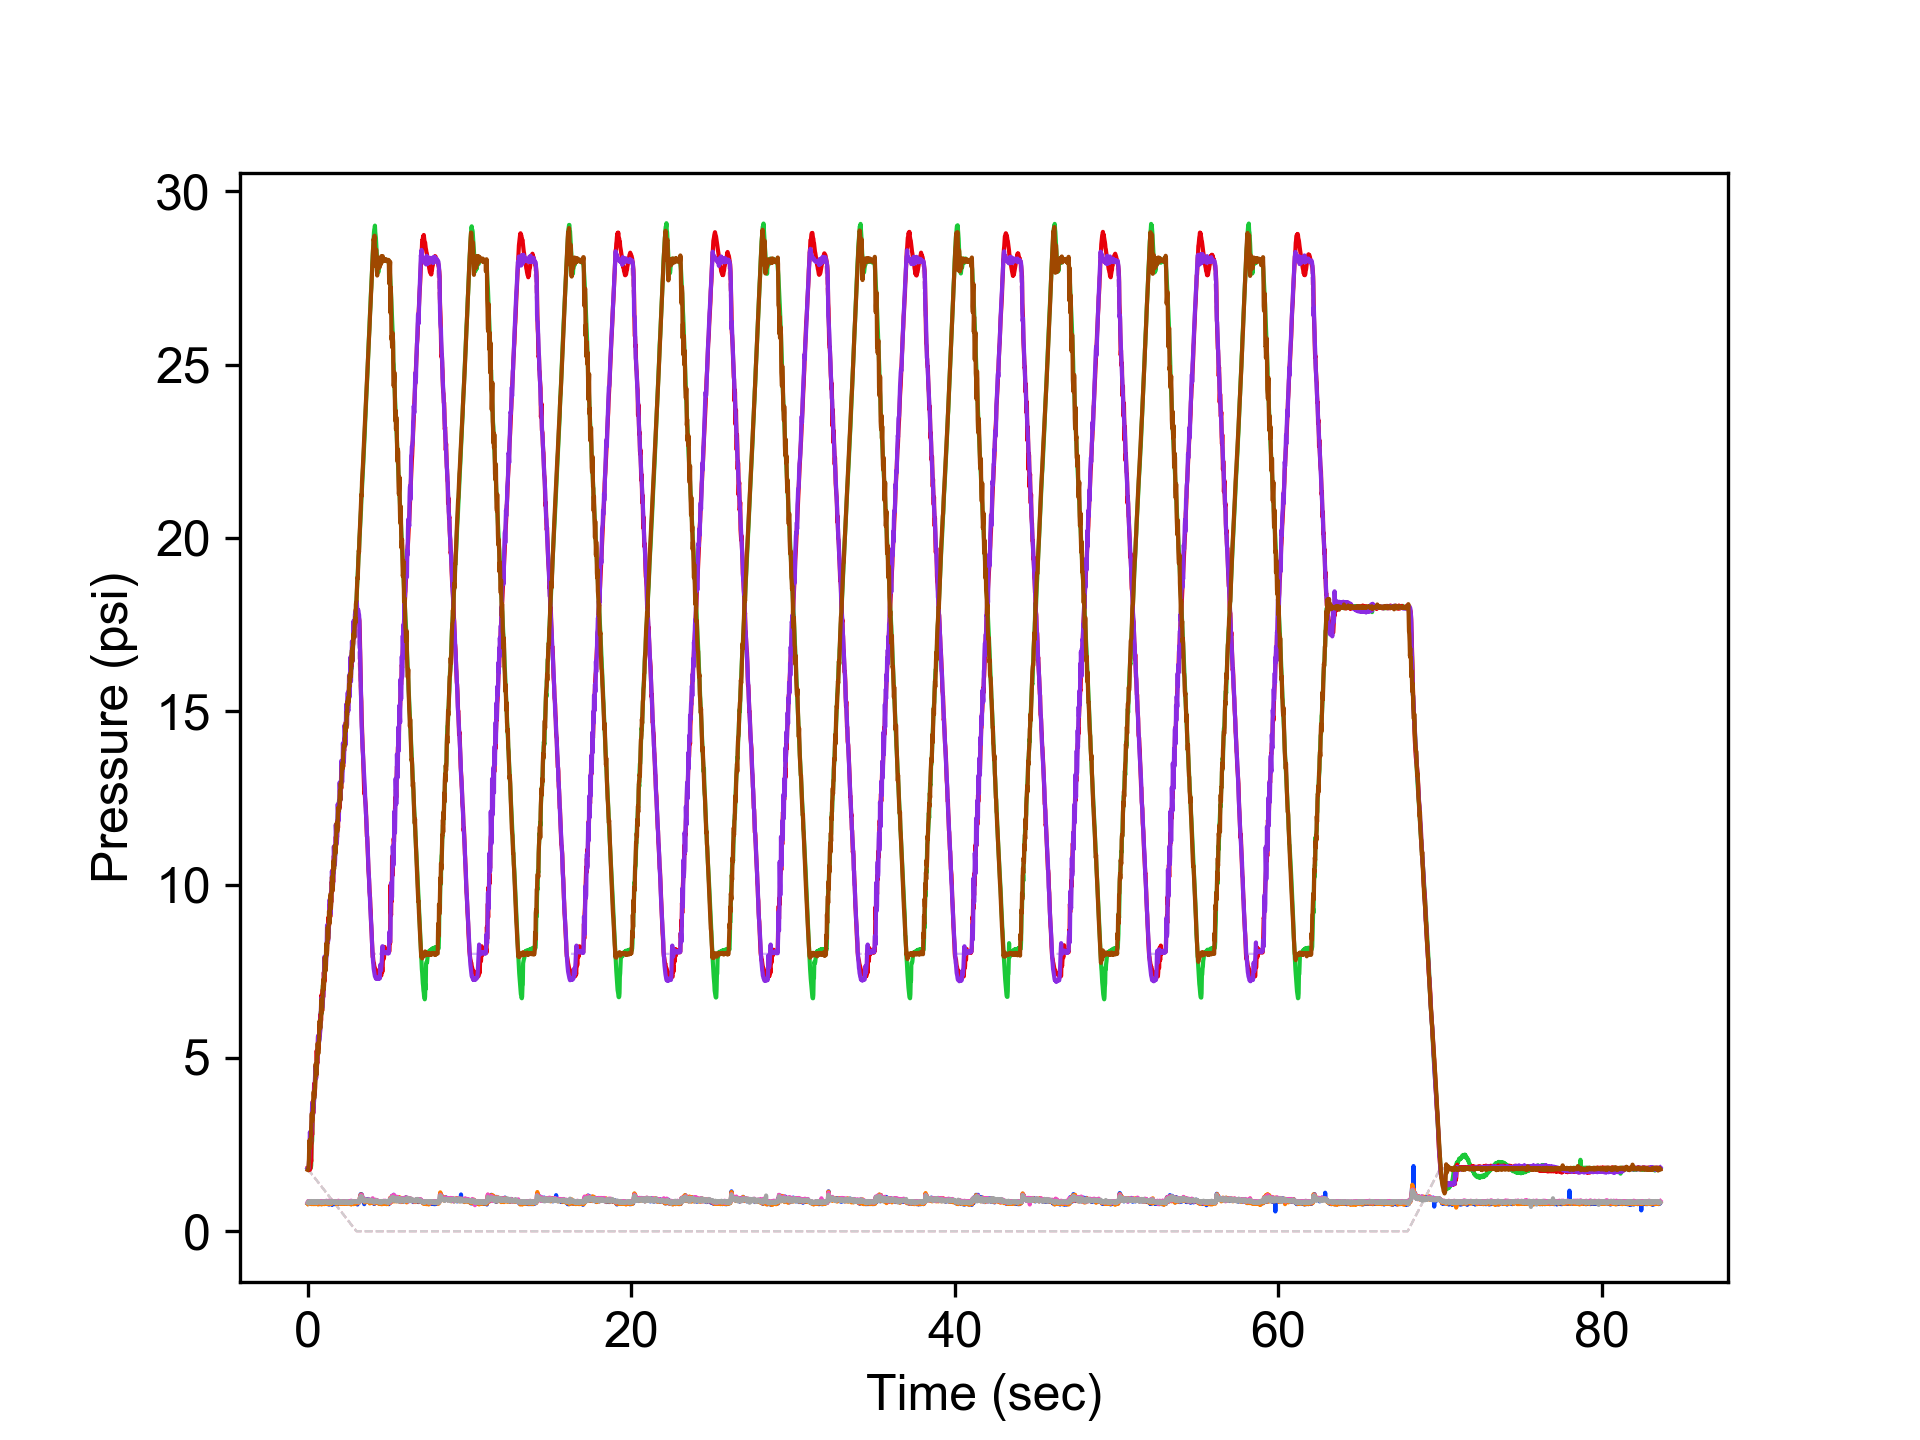
Results of plotting script with real data